Dashboards
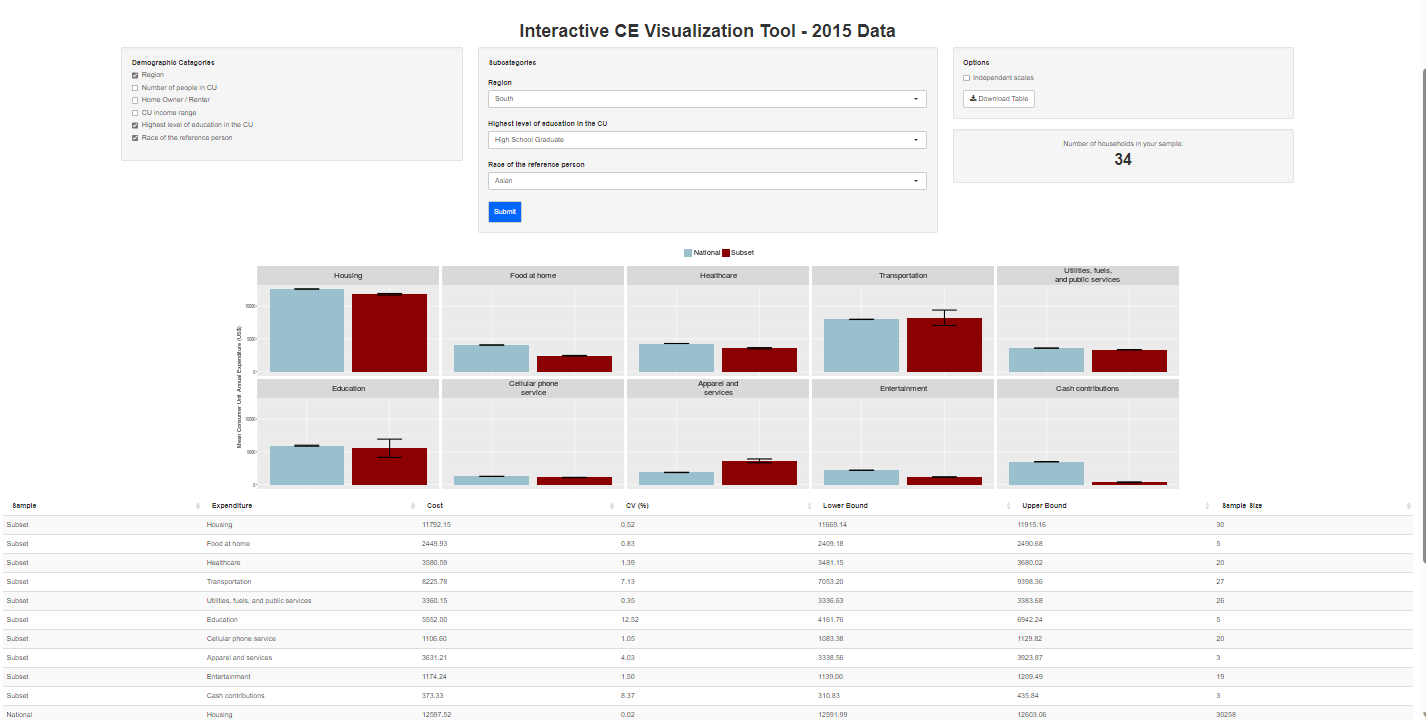
Interactive CE Visualization Tool
I built the Interactive CE Visualization Tool while working as an economist at the U.S. Bureau of Labor Statistics Consumer Expenditure Surveys program. The motivation was to help Public-Use Microdata (PUMD) users better understand some of the methods the program employs to generate annual expenditure estimates. The dashboard helps to answer questions about why it’s not statistically sound practice to generate mean expenditure estimates for certain cross-sections of the data, for example.
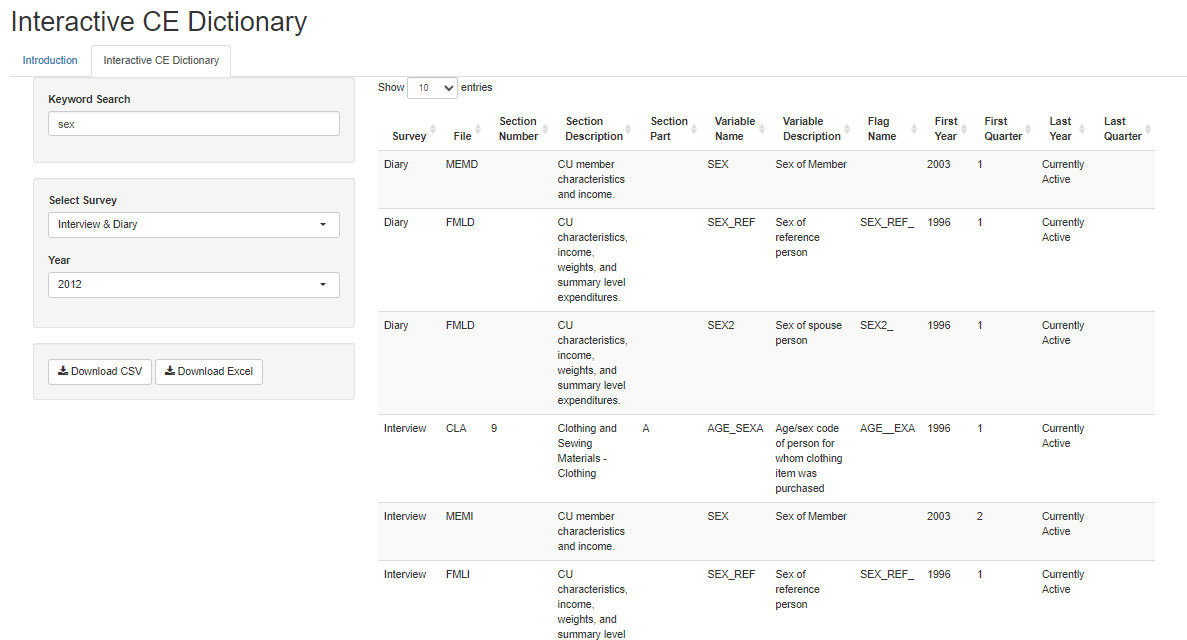
Interactive CE Dictionary
Like the Interactive CE Dashboard, I built the Interactive CE Dictionary while working as an economist at the U.S. Bureau of Labor Statistics Consumer Expenditure Surveys program. Its purpose is to help internal data users interactively search for variables, codes, and other elements of the CE PUMD rather than read through various PDF documents.
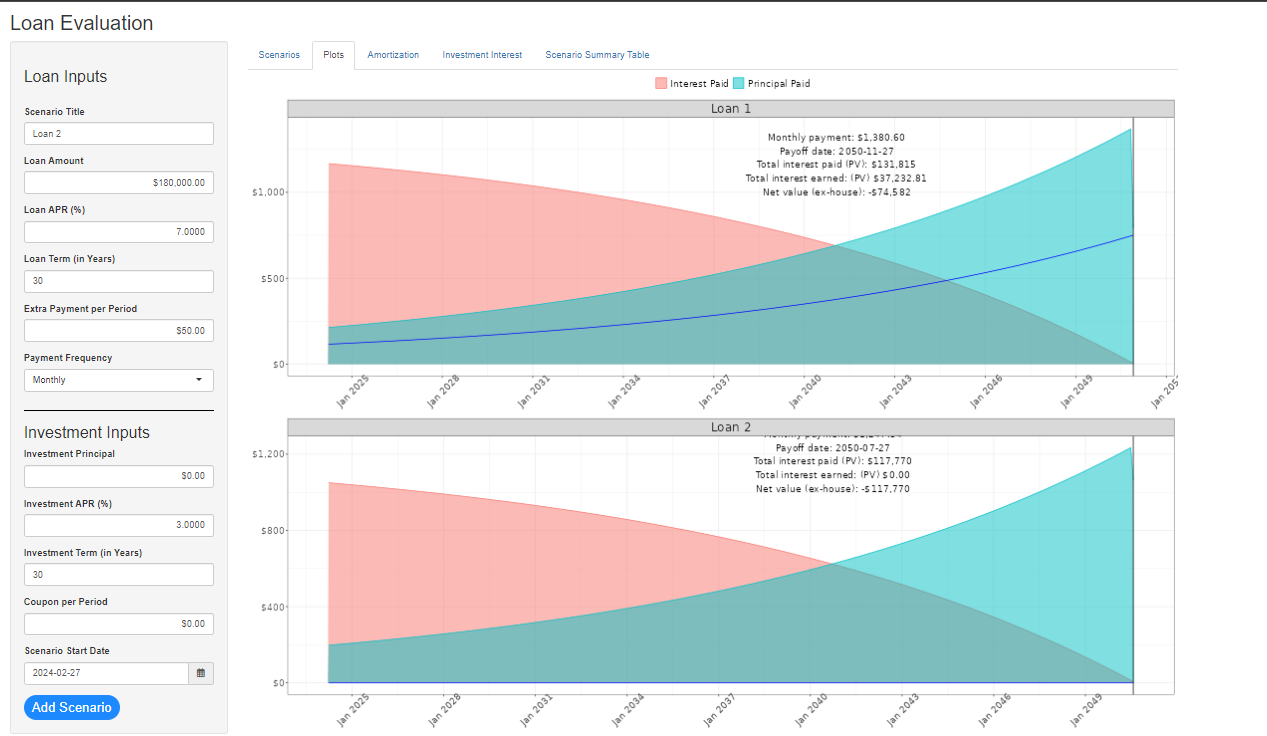
Loan Evaluation App
Some time ago I had to choose between loan products and I wanted to consider using some cash to offset my loan requirement or to invest it. I found myself writing a bit of code to generate things like amortization schedules. I just kept on writing code and built a loan evaluation app. Building this app gave me an opportunity to use the {rhandsontable} package to make interactive tables.
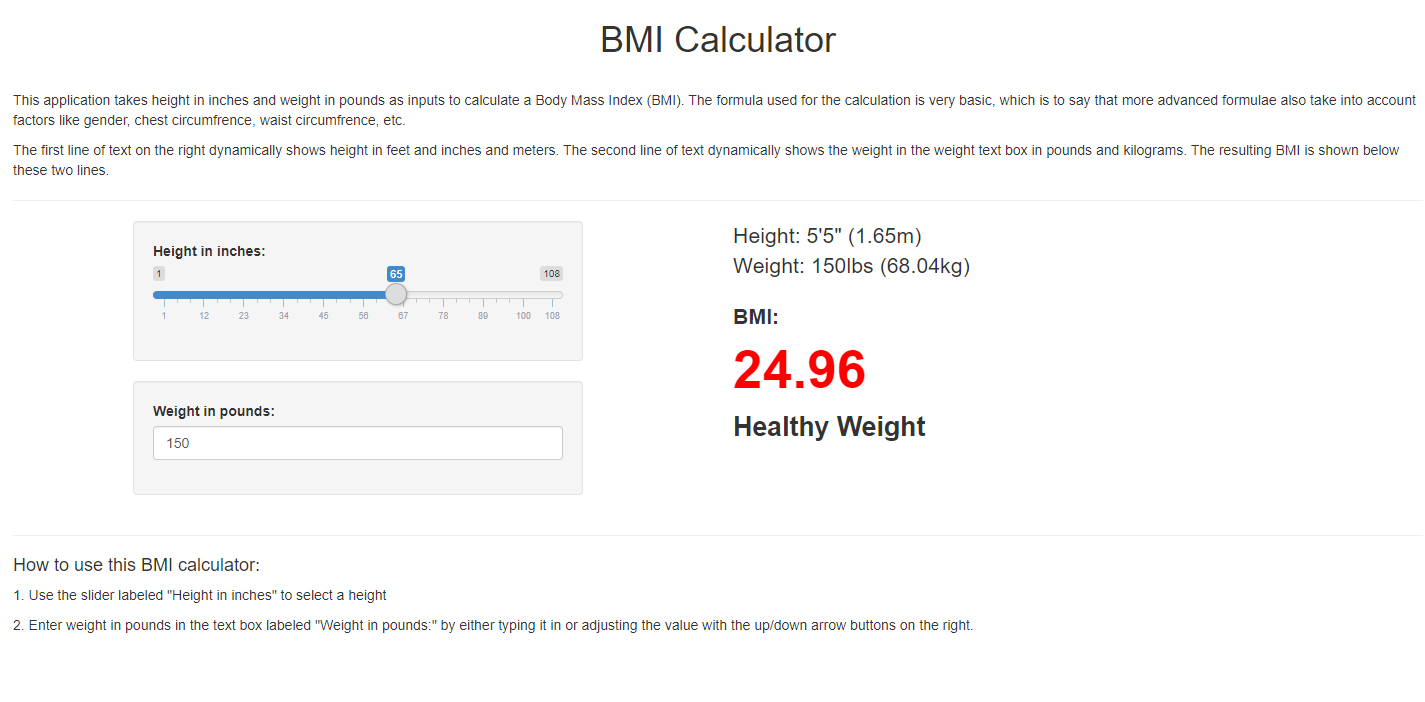
BMI Calculator
The first Shiny app I ever created was a body mass index (BMI) calculator as an assignment for the Data Science Specialization on Coursera. It simply calculates body mass index (BMI) using a very simple formula given the inputs of height and weight.